-
Small business guide to basic Google Analytics
6 Oct 2014 Dominic Comments Off on Small business guide to basic Google Analytics
As a small business you need to make sure that you are using all the information at your disposal to make the best and most informed decisions regarding your online strategy. All to often I have seen businesses make decisions based on gut feel which ultimately have cost them in lost revenue when there was information available to them.
Your website is available 24 hours a day, 365 days a year and not just for your domestic market but also for your overseas markets. By ensuring that you are have Google Analytics set up correctly on your website you can ensure that your business has as much information available as is possible with which to make better decisions.
Google Analytics is free and easy to set up on your site but too often small businesses do not have it set up or have it set inaccurately – meaning they do not get the full benefit of this powerful anlaytics tool. The main benefit of Google Analytics is that it is free and is used universally by all types and sizes of organization in order to improve their online offering.
I have listed below what I believe are the top 10 metrics which provide the most valuable insights into when making tactical decisions regarding your website content and marketing decisions.
My top 10 Google Analytics reports for Small Business
Audience Location
This metric gives you a great overview of where your website traffic is coming from – countries, districts and even cities. This gives small businesses a great advantage when looking at how you can target new markets and if, indeed there is an apetite for your business in those markets. One retailer I worked with had 20% of sales coming from markets overseas in which they had no presence thus enabling them to start focusing on those areas and tapping into a new market.
Audience Engagement
This is a great metric to use in order to track if your audience is actually engaged with your brand. Are they engaged, do they like what they see etc? By looking at such metrics as visitor duration, number of page views and pages accessed you can get an idea if you are doing the right thing or not. Page visit duration is the time someone spends on a given page. Often the time spend on these pages depends on the type of page (eg homepage with lots of offers vs single product page). In addition news pages or blogs may have longer page visit duration as each page has more content to read.
Mobile
Any small business in 2014 needs to understand not only where but from which devices their audience are accessing their website. Mobile traffic makes up almost half, if not more, of retailers website traffic and small businesses need to understand how audiences are engaging with you. If you do not have a mobile optimized website then you will see that your audience engagement may suffer as a result. Or perhaps you will see that conversion is high on some devices but not others – possibly showing that you have an issue with some devices. Your site needs to be mobile friendly in 2014 and preferably responsive also therefore this metric I feel will become even more important in time as businesses look to optimize as much of their web offering as possible.
Traffic Sources
This is one of my favourite methods of tracking performance as it shows where your website traffic is coming from – and by knowing this you can start optimizing your marketing campaigns. By separating out direct (they type into the browser your URL) traffic, organic (they come across you on Google) or referral (they have clicked on a link on someone else site), you are able to see just where your audience are seeing you online. As you then begin to grow this metric becomes more important as you will probably start spending money on paid search or affiliate traffic and thus need to understand these numbers in order that you can determine your ROI.
Social Media
As a small business, perhaps just starting out, one of the first ways of getting your brand known is through social media. Analytics enables you to see how your social media presence drives traffic onto your site and from what social media. By analyzing this data, you will be able to see the types of referrals you are getting and this will also enable you to tailor your marketing effort to the channels that work and alter your strategy for any social media that is underperforming.
Dashboards
Given the wealth of information available in Analytics, the best way I have come across to manage its via dashboards – ie pulling all your relevant reports into one easy to see snapshot of the metrics which are important to your business. I used the small business dashboard which was set up by Google for a previous client which really helped me and the client get an instantaneous idea of how the site was performing. The dashboard allowed us to see in a snapshot such metrics as number of visits, bounce rate, mobile visitors, revenue etc. Download the Google Analytics Small Business Dashboard here
Bounce rates
If someone lands on one page of your site, looks at it and then leaves, we call that a “bounce”. Most of your traffic will arrive on site and bounce immediately – this is common. Your challenge is to get that bounce rate down as best you can by ensuring that your site is as engaging as possible and offers the audience what they are expecting. Average retail bounce rates would be around 30% however this differs across industries. By looking at pages where you have high bounce rates you can often identify problems – eg the product image is incorrect, the price is too expensive or there may be an issue with the page itself. I like to ensure that these are checked on a monthly basis and the results are fed back to the relevant people in the organization. Improving your bounce rate will also improve your sites authority in Google eyes – thus improving your SEO (and improving your conversion rate).
Site search
In many retailers I have worked with this metric has often been ignored yet it can provide you with valuable information regarding how your audience are using the site and what they could be having problems with. Your audience will use site search to find things they are looking for but cannot find on the site. An example is where one product is advertised but the product title may be different and thus not show up in your main navigation. The information from site search should be used by you to feedback into your paid search campaigns plus should also inform you of the products people are looking for but cannot find on your website. This may be because they are poorly described or because they aren’t on the site – thus informing your product range strategy. Site search is invaluable for giving you an idea of what your audience want.
Events
The events metric provides website owners with keen insights into user engagement by displaying a summary of the on-page activities of users. Specific reports display the activity and patterns of users scrolling through specific web pages. For example, events including when the page was loaded and scrolling activity can be determined using this metric (this feature is only possible with a custom setup within a website). This information can be used to test the best placement of calls to action on any given web page.
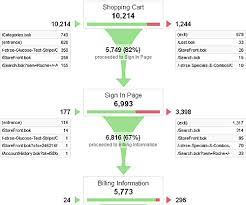
Funnel visualization
This is one of the most powerful tools within analytics and can be used to give you a good idea of how your website traffic is converting based on the goals you have set up. Let me explain – if you are getting a fairly steady stream of visits – say 5,000 visits per day – then you should have a fairly steady rate of conversion on site. If your conversion rate is say 4% for a retailer, then you can expect 4% of this 5,000 making it through to actually purchase goods from your site. It does not need to be buying a product – it could be downloading a PDF file for example.
The point being that funnel visualization can be set up for just about any goal your business may have. The benefit of having these funnels is that you can see where one step of the process is not working – and do something about it. Another example may be that you see 90% of people who view a product page abandon and do not purchase. Why would that be? It may be that you charge excessively high postage and packing fees in which case you could look at testing the impact of reducing your rates. Funnel visualizations are an important part of Conversion Rate Optimization and should be set up whatever your company offers.
Google Analytics is an extremely powerful tool for small business but does not need to overcomplicate your reporting. Use it to make informed decisions about your business moving forward but by setting up the 10 reports about you should be in a great position to get to grips with the basics of your site’s performance.
Why small business sites need a blog Google’s checkout – imagine if this was your website..?
07592 629885 | dominic@redleafdigital.co.uk
Comments are currently closed.